
For corporations
Keep customers and partners informed.
Give each audience access to relevant reports and dashboards. Replace repeated report requests with a shared place to explore the numbers and ask questions.
How it helps
Create analytics workspaces for customers, partners, vendors, and internal teams. Share approved data, keep access rules in place, and schedule recurring reports when needed.
Who this is for
- CIOs and data leaders
- Operations leaders
- Finance teams
- Customer portal owners
The problem
Reduce repeated spreadsheet requests.
Manual spreadsheet exports
Recurring report requests are slow, risky, and hard to govern.
Customer and partner visibility
External audiences need recurring answers without raw data access.
Metric consistency
Internal teams can define metrics differently without governed semantic models.
AI governance
AI usage must be limited to approved datasets and fields.
The answer
What does InfuseBI give corporate data teams?
01
Secure dataset publishing
One governed model, every audience scoped to its own rows.
- ✓One governed model serves every audience
- ✓Field visibility controlled per audience
- ✓No raw database access ever shared
Sales − returns − discountsOwner: Finance · Currency: USD02
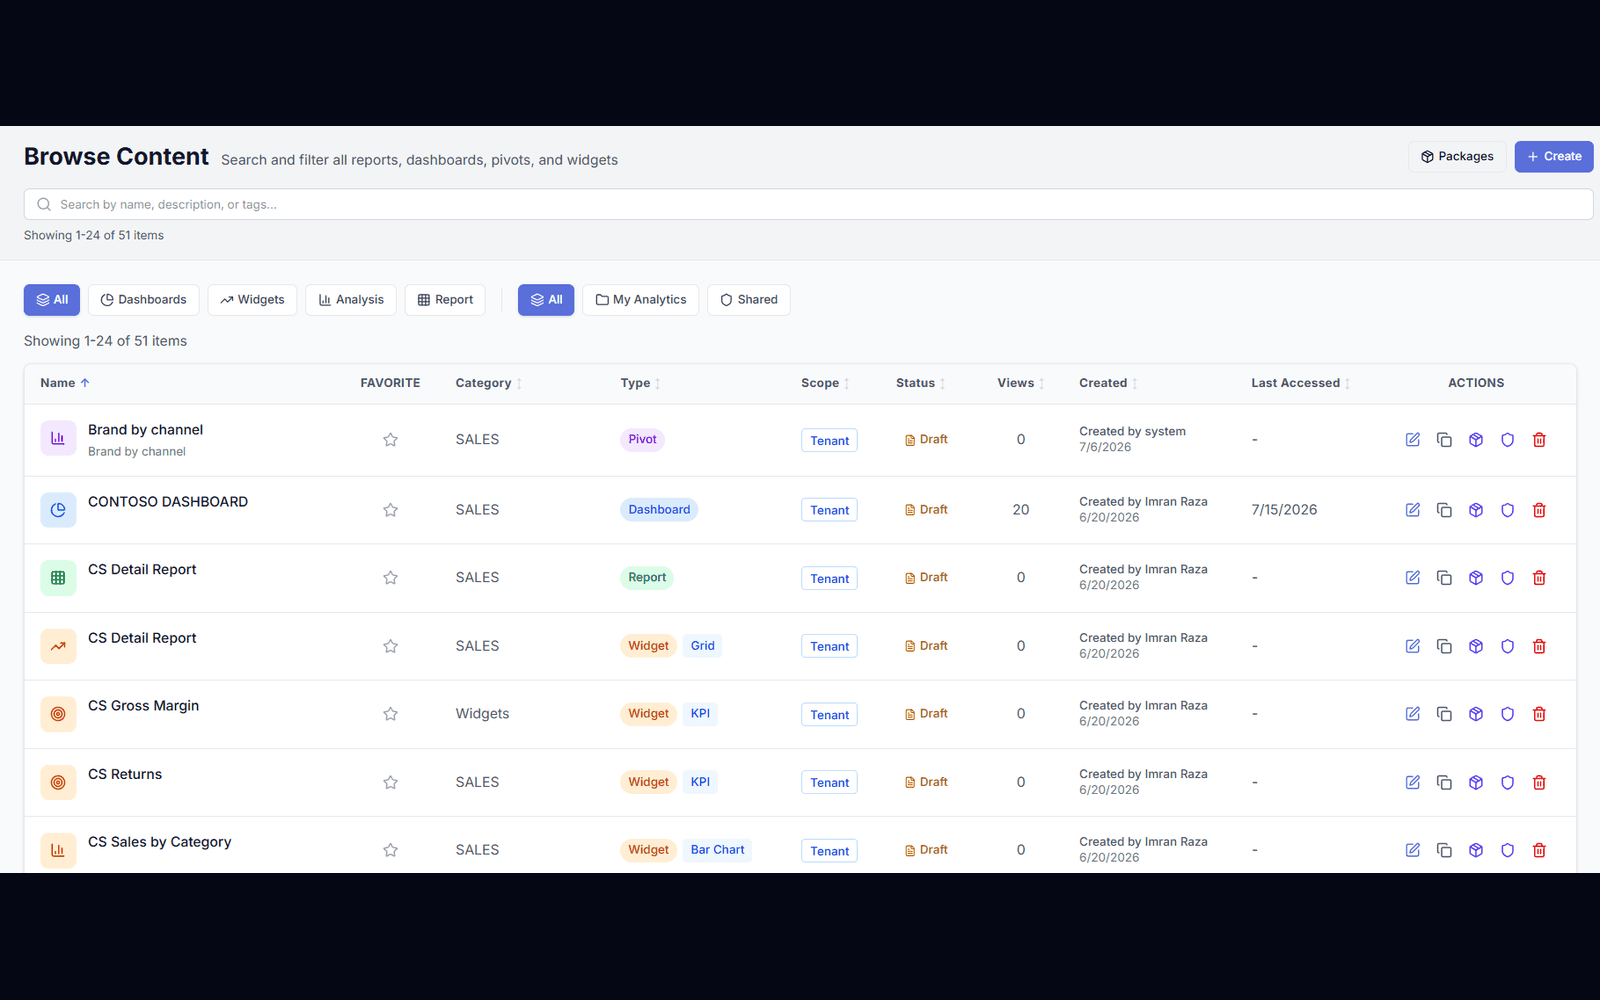
Dashboards, reports, and pivots
Give each audience interactive analytics and power-user workflows in a branded portal.
- ✓Interactive portals for each audience
- ✓Power-user pivots for finance and operations
- ✓Branded and SSO-mapped access
03
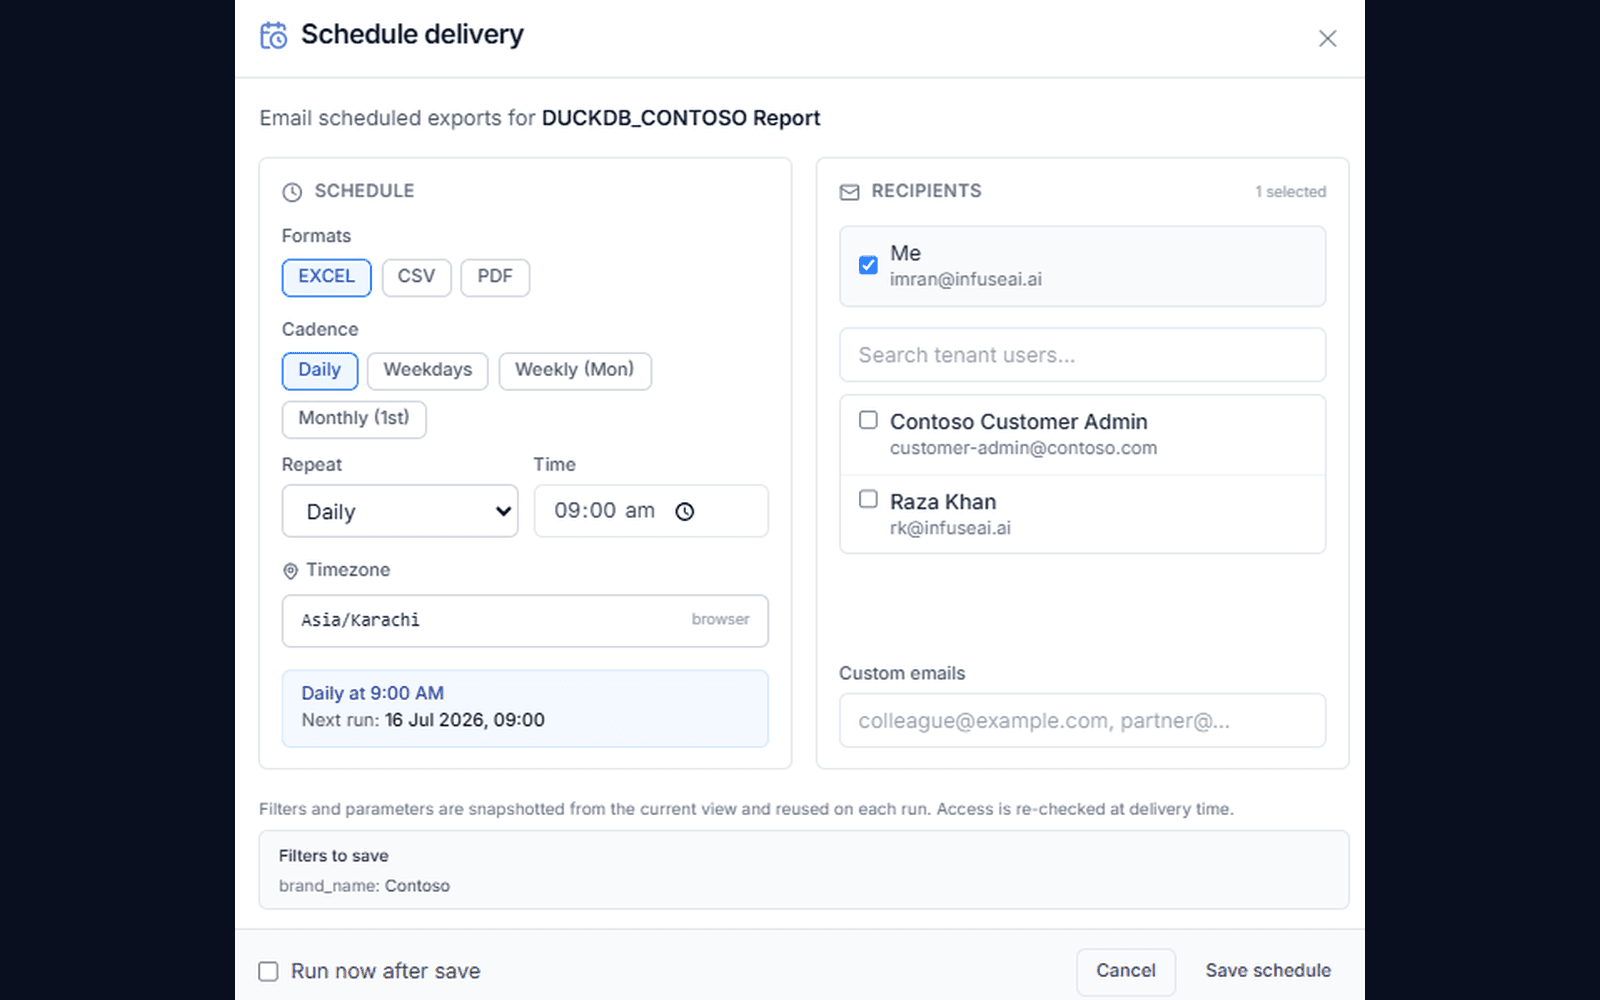
Scheduled Excel/PDF exports
The right file, to the right people, on schedule.
- ✓Automatic recurring delivery
- ✓Right file, right recipients, on time
- ✓Every delivery logged and auditable
04
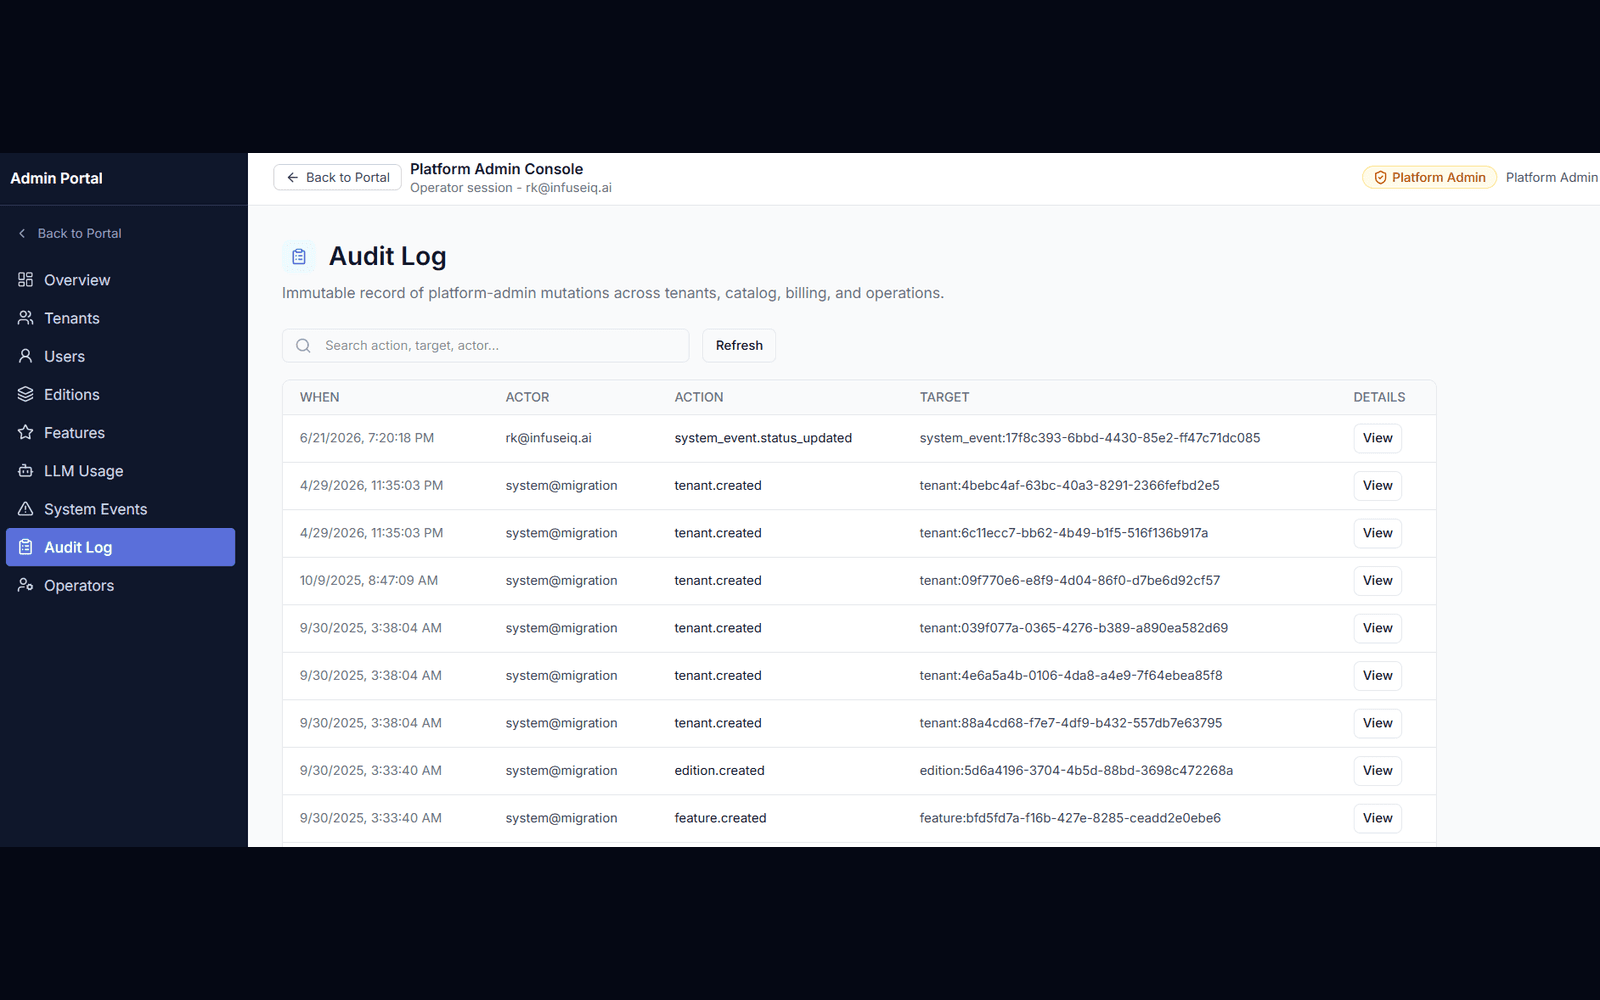
Audit and access controls
Govern roles, rows, exports, schedules, and AI chart creation with full audit visibility.
- ✓Roles, rows, exports, schedules, and AI in one policy
- ✓Activity history for access and changes
- ✓Compliance-ready visibility for security reviews
How it works
How do corporations replace manual reporting?
Publish one governed dataset and fan it out — each audience gets its own scoped, exportable, AI-answerable view.
- 1
Prepare a report
Choose the data and metrics to include.
- 2
Choose the audience
Select the customers, partners, or teams.
- 3
Set their access
Configure records, fields, and export permissions.
- 4
Keep it available
Offer a portal or schedule approved reports.
Each audience receives the view allowed by your configured access rules.
Ready when you are
Bring your toughest data question.
See how your AI analyst and data scientist can turn it into findings your team can review and use.
FAQ
Frequently asked questions
How can corporations use InfuseBI?+
Corporations use InfuseBI to publish governed analytics portals for customers, partners, vendors, business units, and internal teams. Each audience gets scoped dashboards, reports, and pivots from one governed foundation.
Can InfuseBI replace spreadsheet reporting?+
Yes. InfuseBI replaces recurring spreadsheets and static PDFs with interactive dashboards, reports, pivots, and scheduled exports — governed by row-level security and export permissions.
Can each customer or partner see only their own rows?+
Yes. Each audience is mapped through SSO to a row-level scope — by customer, partner, region, location, or account — and that filter is applied before any dashboard, report, export, or AI answer is produced.