
Who behaves differently?
Explore clusters by frequency, value, and behavior.
Your analyst + data scientist
Your AI analyst explains the numbers. Your data scientist prepares data, builds forecasts, and tests models. Review their work, ask a follow-up, and share useful results.
How it helps
Use the AI workspace to investigate performance, prepare data, forecast trends, and explore patterns. Review the methods, findings, and output files. Authorized users can publish result datasets and schedule approved analysis.
Who this is for
From curiosity to action
Start with a business question. Keep asking as the analysis takes shape.
Clarify the goal, select accessible data, and agree on scope before the work begins.
Explore patterns, prepare data, and run the statistical or predictive work the question needs.
Inspect findings, assumptions, validation, and the executed notebook. Ask for a different approach.
Publish an approved result as a dataset, build reports and dashboards, or set up an approved recurring analysis.
Two complementary capabilities
Move naturally between exploring a metric and doing the deeper work behind a decision.
01
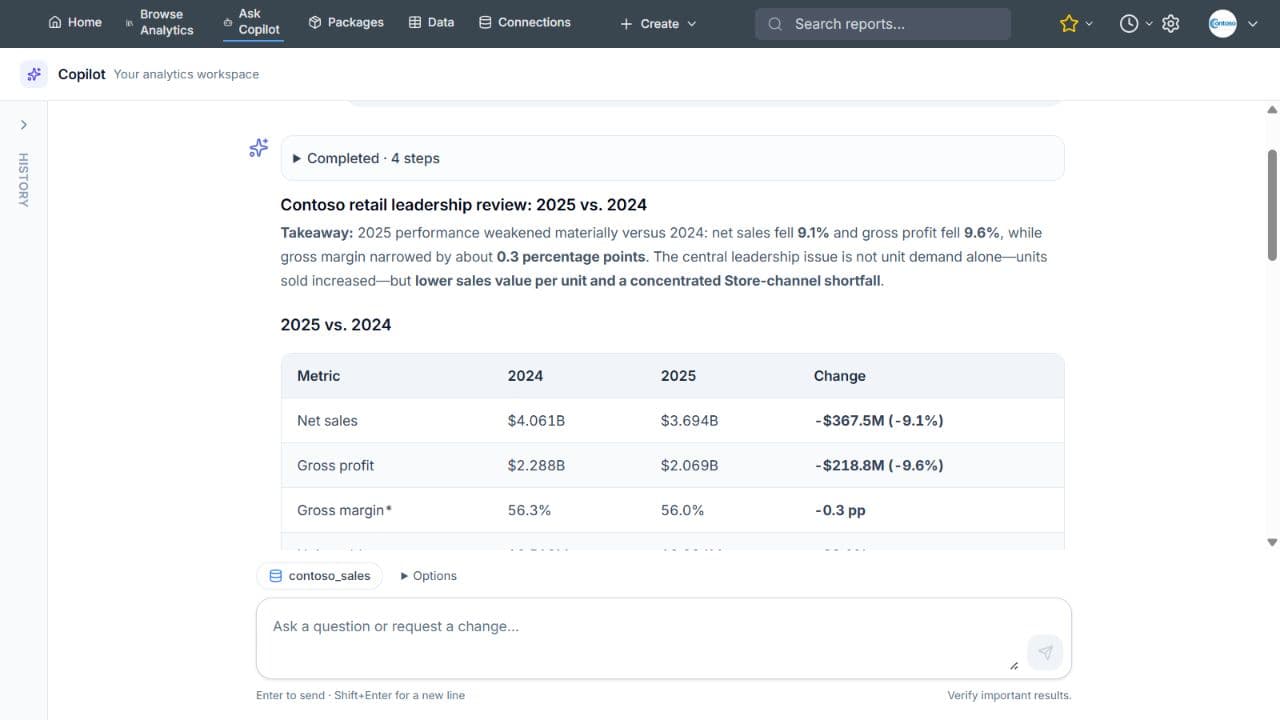
Explore performance in plain language. Compare periods, investigate the contributors to a change, and turn the findings into clear charts and a business narrative.
02
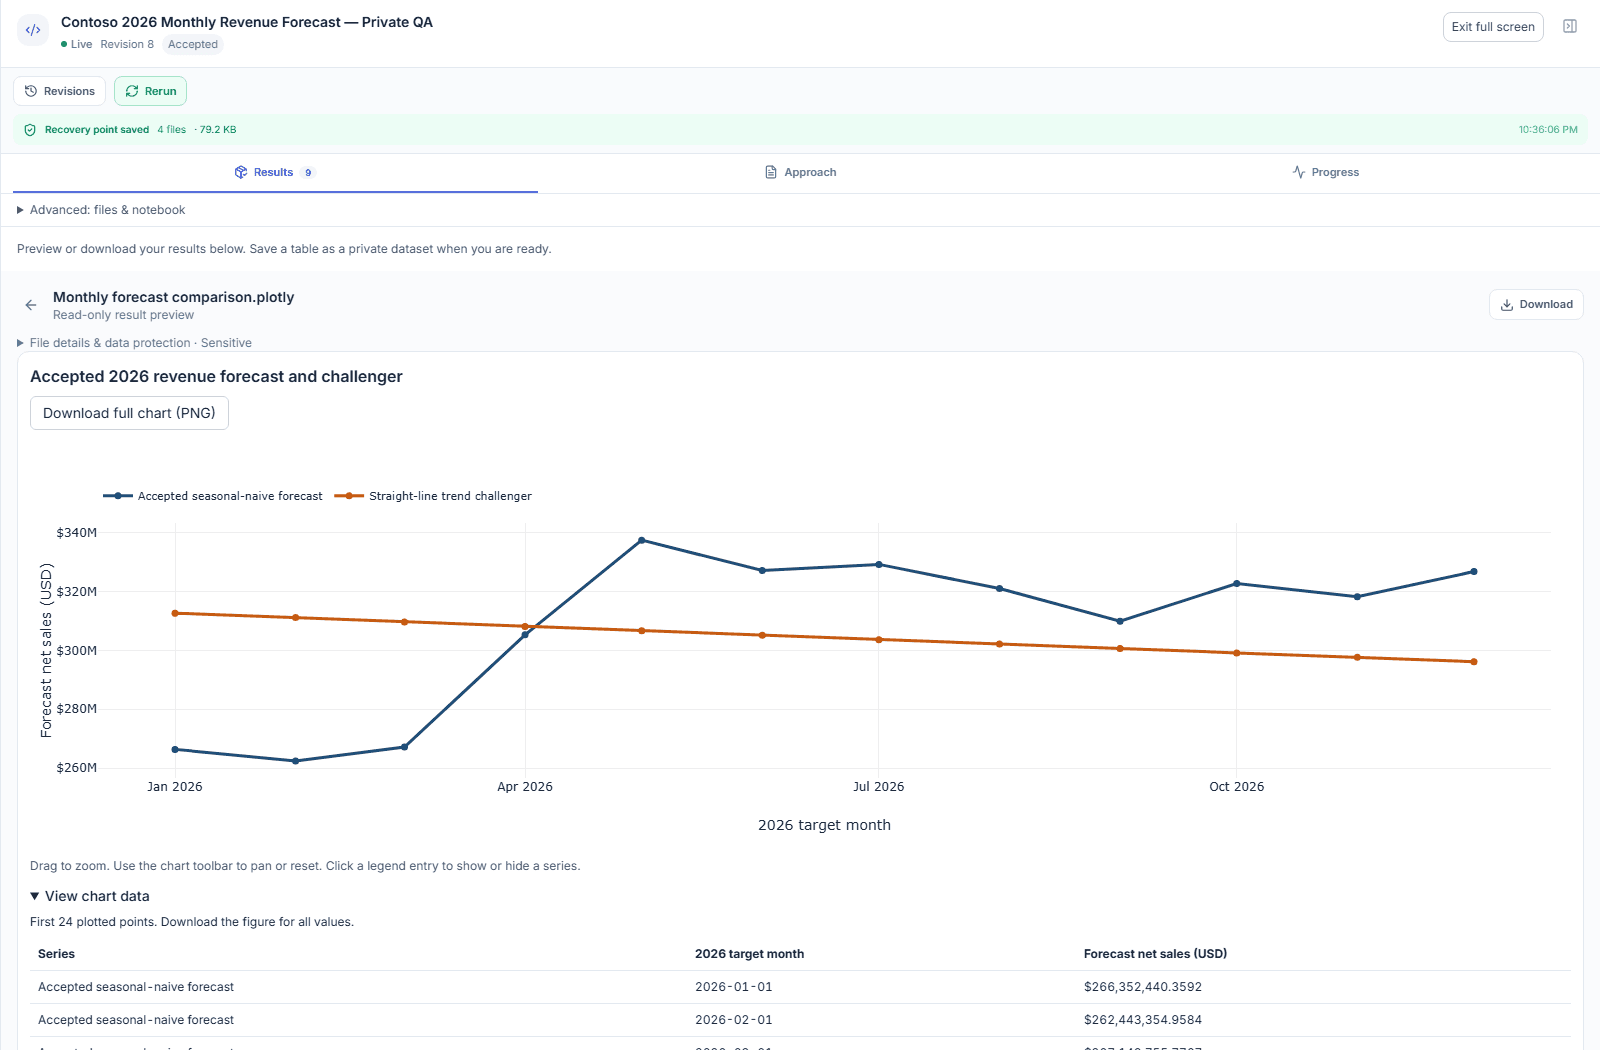
Prepare data and run analytical code for forecasting, statistical analysis, segmentation, regression, classification, and anomaly detection. Review the chosen approach and its limitations alongside the output.
03
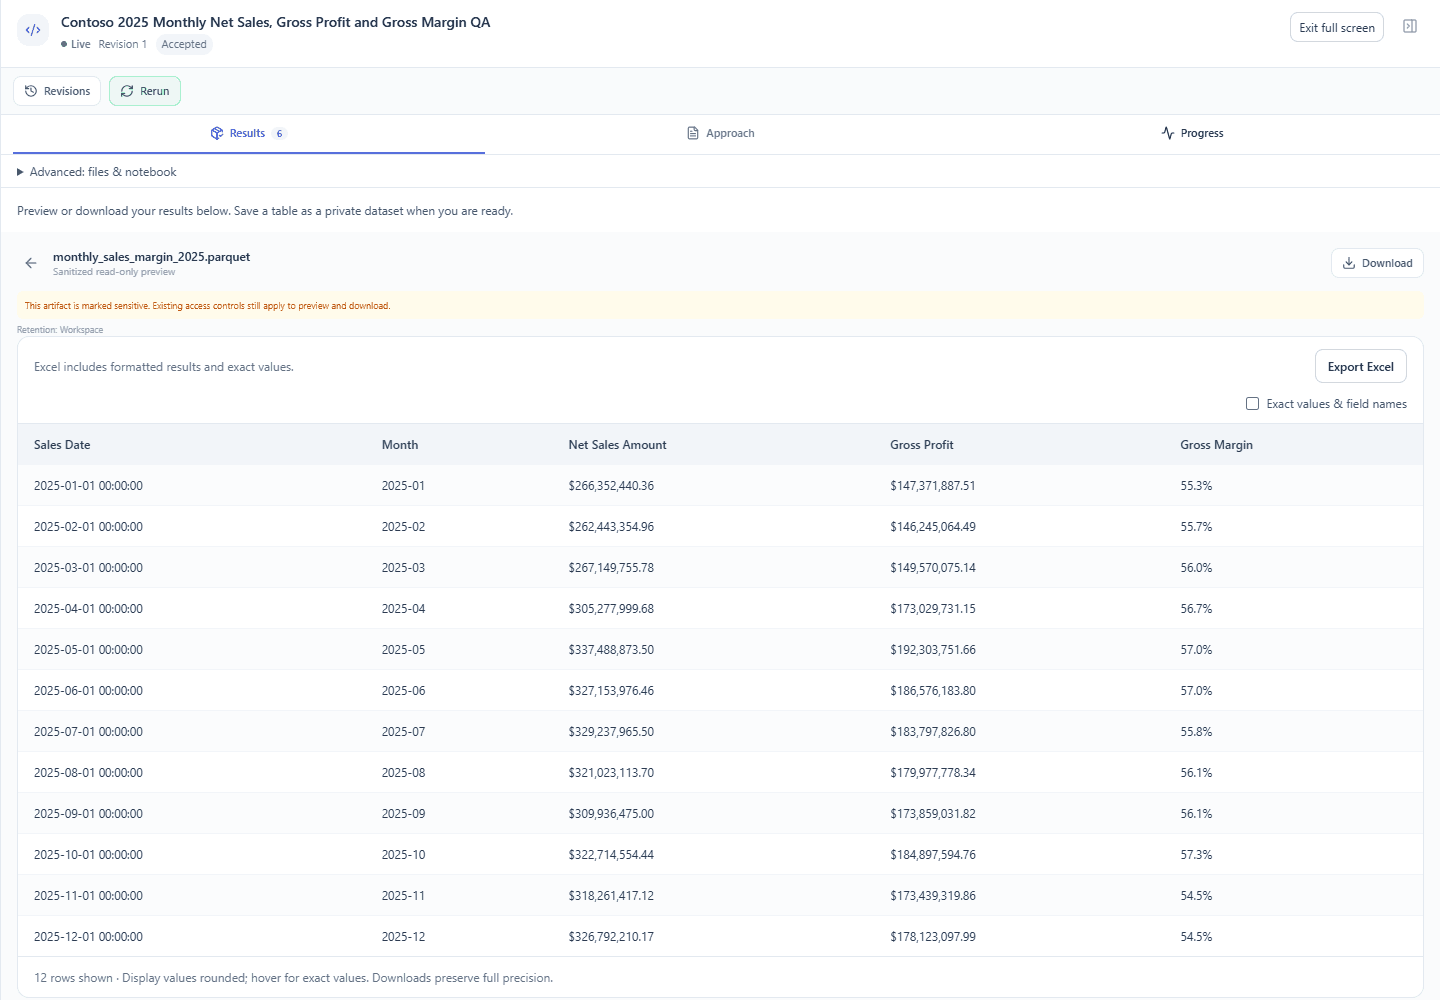
Continue a saved analysis, compare revisions, and promote useful outputs into governed datasets. Review the target and update method before changing existing data.
A wider range of questions
Explore future demand or revenue, compare against a baseline, and review uncertainty.
Find meaningful groups and translate their profiles into actions your team can test.
Model relationships and outcomes with appropriate features, validation, and limitations.
Surface unusual records or changes and investigate the business context.
Examine distributions, relationships, data quality, and the evidence behind a hypothesis.
Combine authorized inputs, transform fields, and produce reusable analytical datasets.
Different questions need different views
Use the visual that makes the pattern clear—then inspect the method and the underlying data.
Explore clusters by frequency, value, and behavior.
Separate the factors that add to or reduce a result.
Compare customer groups over time, beyond an overall average.
Work that travels
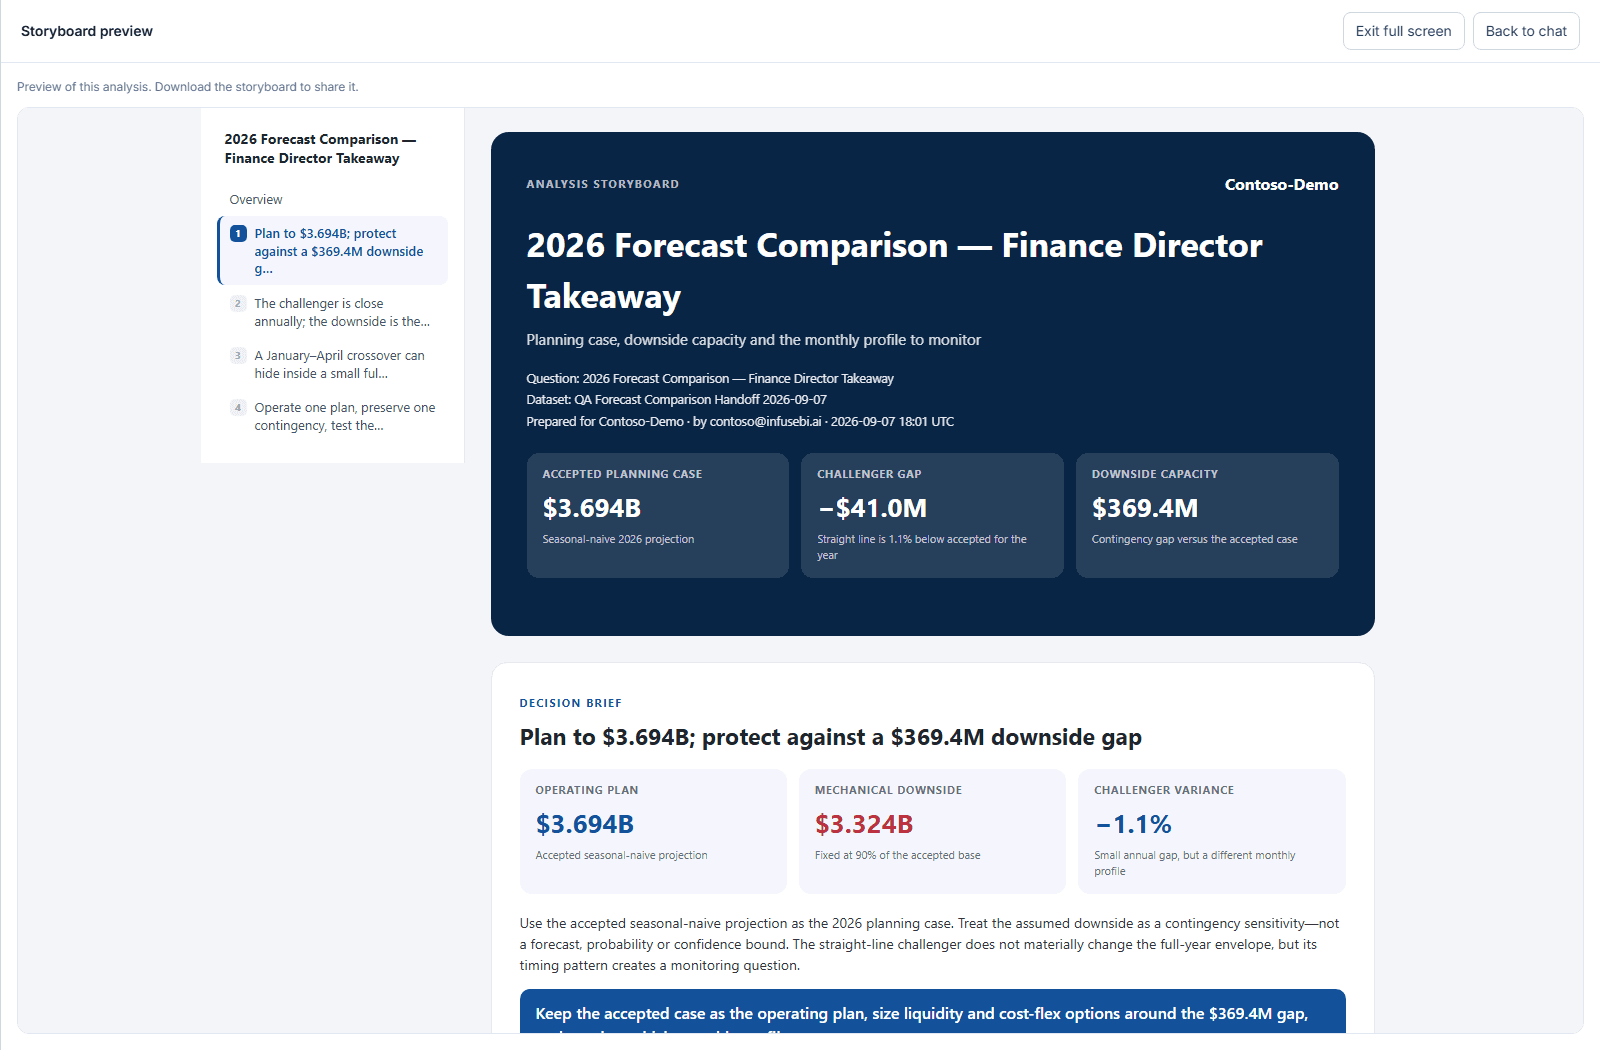
Use the result where decisions happen. Publish a dataset for ongoing reporting, build a dashboard, or turn supported findings into a branded storyboard.
Enterprise foundations
Your data, users, and approval rules remain part of the workflow.
Dataset access, tenant boundaries, and field controls govern which inputs are available.
Keep the analysis, outputs, revisions, and execution history available for inspection.
Review dataset updates and approve a method before enabling recurring execution.
Use governed dashboards and reports internally, in customer portals, or embedded in your product.
Ready when you are
See how your AI analyst and data scientist can turn it into findings your team can review and use.
FAQ
The data scientist prepares data and executes analytical code for statistical exploration, forecasting, regression, classification, clustering, and anomaly detection. Results include inspectable notebooks and output files. The appropriate method depends on the question, available data, and configured runtime capabilities.
A chart describes a view of the data. A data science task can prepare new data, test an analytical approach, compare models, and produce reusable results. The analyst helps translate the findings into business explanations and visualizations.
Yes. You can review the analysis, its notebook and outputs, and request a follow-up revision. Check assumptions and validation before relying on a model or publishing the result.
Yes. Authorized users can publish results as new datasets or review changes to existing datasets. Approved analysis methods can be configured for recurring refresh, with permission checks and execution history.
No. The website walkthrough uses prepared, synthetic examples and does not call a live AI model. Your question stays in your browser and selects a sample scenario. Request a demo to discuss your own data and workflow.
Yes. The analyst and data scientist sit within InfuseBI’s governed analytics platform, alongside dashboards, reports, pivots, exports, customer workspaces, and embedding.