
Embedded analytics
Bring analytics into your application.
Give customers dashboards, reports, and an AI analyst inside the app they already use. Match your branding and control which data each customer can access.
One login. Your branding. Reporting in context.
How it helps
Add InfuseBI dashboards, reports, pivots, and AI analysis to your application. Your integration connects the user’s identity to the data and actions they are allowed to use.
Who this is for
- SaaS founders and CTOs
- Product leaders shipping analytics features
- Engineering teams replacing homegrown reporting
- Customer success teams reducing report tickets
Why embed
Turn reporting from a support burden into a product capability.
Native product experience
Analytics appears inside your app, not as a disconnected BI portal.
Access for each customer
Every user sees only data their tenant is allowed to access.
Self-service for customers
Authorized customers can build their own dashboards, reports, and pivots.
AI-assisted creation
Users can create or update charts by asking in natural language.
White-label ready
Match the analytics experience to your product design.
Export and schedule
Let tenants export Excel/PDF or schedule recurring reports.
Embedding options
What can you embed with InfuseBI?
01
Full dashboard embed
The complete dashboard experience, loaded inside your app and styled to match your product.
- ✓Interactive filtering, drill-down, and saved views
- ✓Loads inside your UI — no separate BI portal
- ✓Theme sync with your product's design tokens
- Electronics36%
- Home29%
- Outdoors23%
- Other12%
02
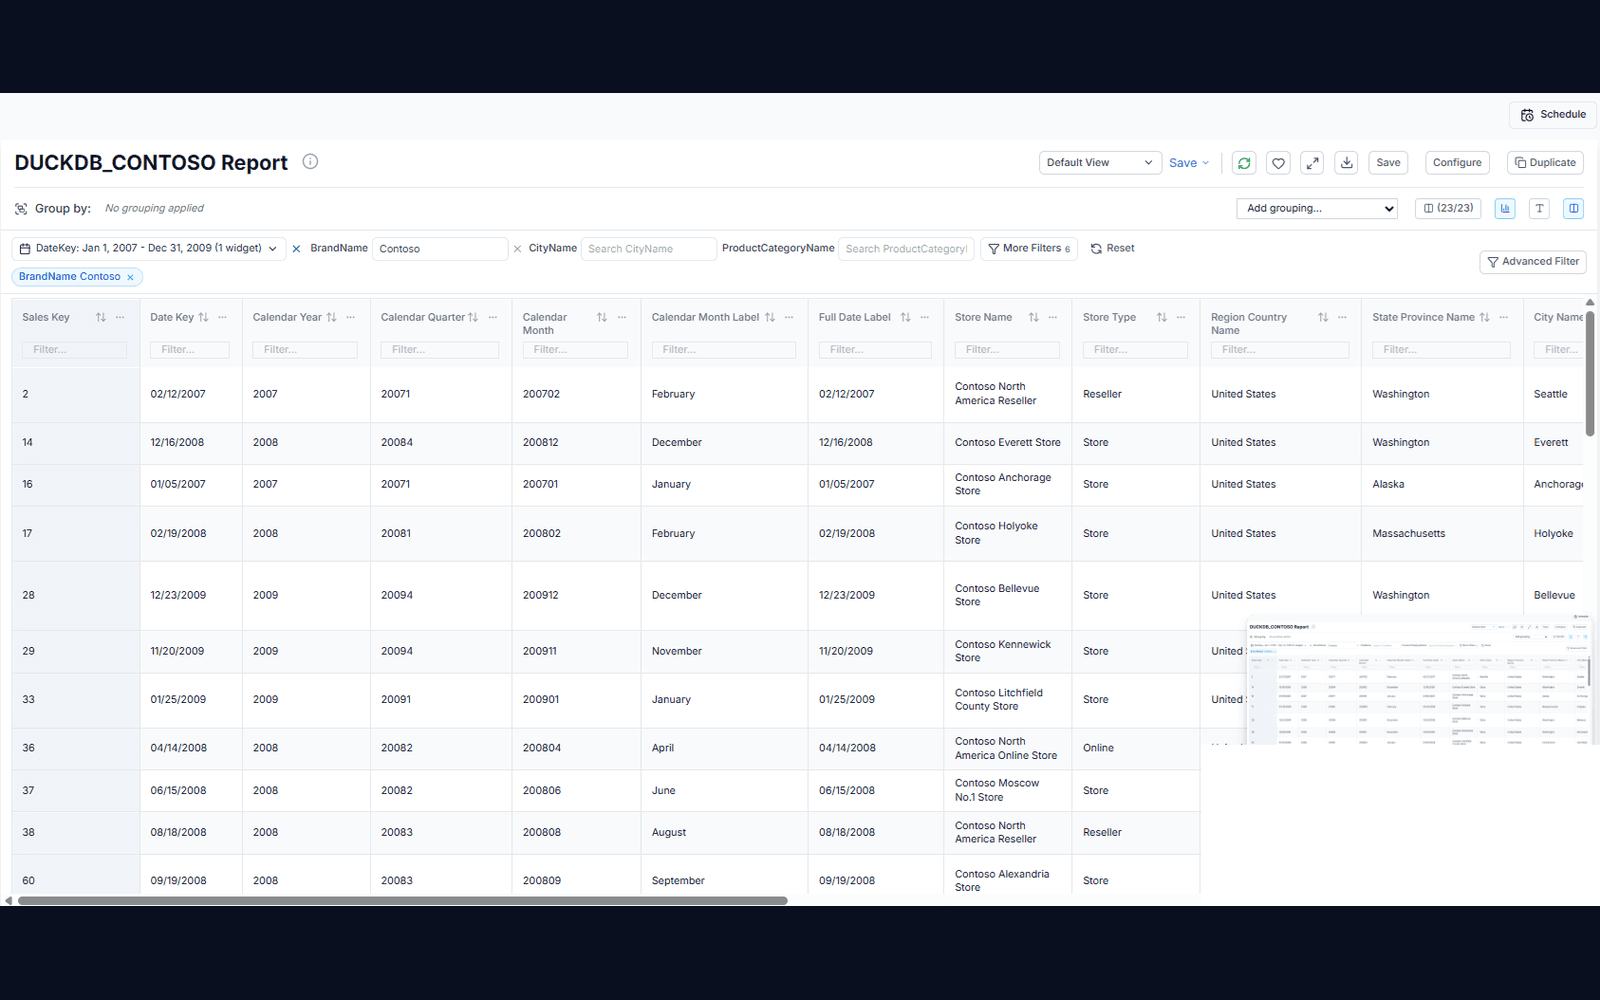
Report embed
Operational reports, statements, and compliance outputs — filters, formatting, and export built in.
- ✓Paginated tables with rich data formatting
- ✓Parameter-driven: account, date range, status
- ✓Excel/PDF export within permission policy
03
Pivot embed
Excel-grade flexibility for power users, without leaving your product.
- ✓Drag-and-drop measures and dimensions
- ✓Subtotals, grouping, and saved pivot views
- ✓Excel export that preserves the pivot layout
| Region | Q1 | Q2 | Change |
|---|---|---|---|
| West | 482 | 561 | +16.4% |
| Central | 391 | 420 | +7.4% |
| East | 514 | 602 | +17.1% |
| Total | 1,387 | 1,583 | +14.1% |
Group, compare, and drill into a useful view.
04
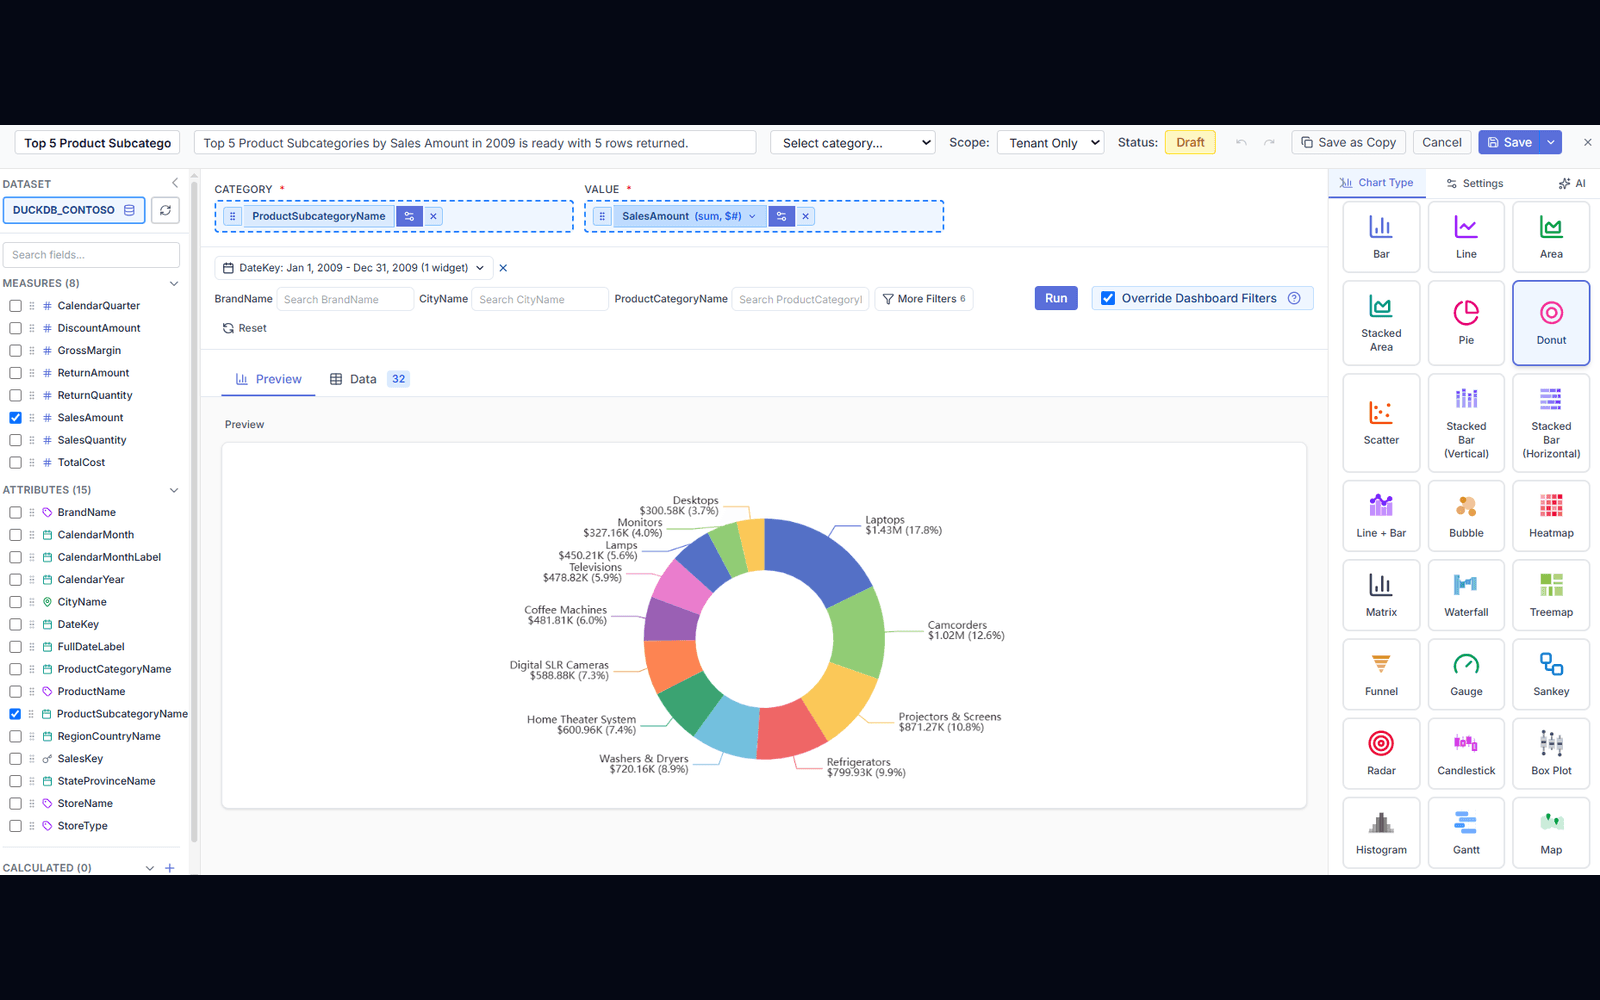
Chart component embed
A single governed chart dropped into any page of your application.
- ✓A single governed chart in any product page
- ✓Two-way events: filters, clicks, and refresh
- ✓Same row-level security as full dashboards
05
AI analytics assistant embed
Your users ask in plain language, inside your product.
- ✓Plain-language chart creation inside your app
- ✓Approved datasets and fields only
- ✓Every prompt and output audited
06
Customer portal launch
A separate branded workspace on the same identity and governance.
- ✓Branded workspace on its own URL
- ✓Same SSO and tenant mapping as your product
- ✓Dashboards, reports, pivots, and AI in one place
What changed.
What to do next.
+$73K Gross profit changeCheck the volume increase by customer and product.
Investigate returns before scaling the same approach.
How it works
How does embedded analytics stay secure?
Your backend mints a short-lived token carrying tenant and role claims; a two-way bridge keeps theme, parameters, and events in sync.
- 1
Sign in to your app
Users keep their existing login.
- 2
Confirm access
Your backend passes the user's authorized context.
- 3
Open analytics
Reports and dashboards appear inside your app.
- 4
Explore the data
Permissions control the available views and actions.
Your integration configures the connection, identity mapping, and access rules.
Ready when you are
Bring your toughest data question.
See how your AI analyst and data scientist can turn it into findings your team can review and use.
FAQ
Frequently asked questions
Can InfuseBI be embedded inside a SaaS application?+
Yes. InfuseBI supports embedding dashboards, reports, pivots, chart components, and AI analytics experiences into SaaS applications. Embedding options range from single chart components to a full branded analytics workspace.
Can tenants create their own dashboards?+
Yes. SaaS tenants can be given controlled self-service dashboard, report, and pivot creation capabilities. Everything they build stays inside their tenant boundary and your governance rules.
Does embedded analytics support SSO?+
Yes. InfuseBI supports SSO and tenant-aware data access mapping, so your product identity drives analytics permissions without separate logins.
How do embedded analytics inherit our application's permissions?+
Your backend mints a short-lived embed token carrying tenant, user, and role claims from your own identity system. InfuseBI resolves that token into row-level rules on every query, so an embed can never widen what a user could already see in your product.