
PERFORMANCE · EXPLANATION · REPORTING
Your AI analyst
Explains performance, investigates changes, and creates the charts and reports that help your team understand the business.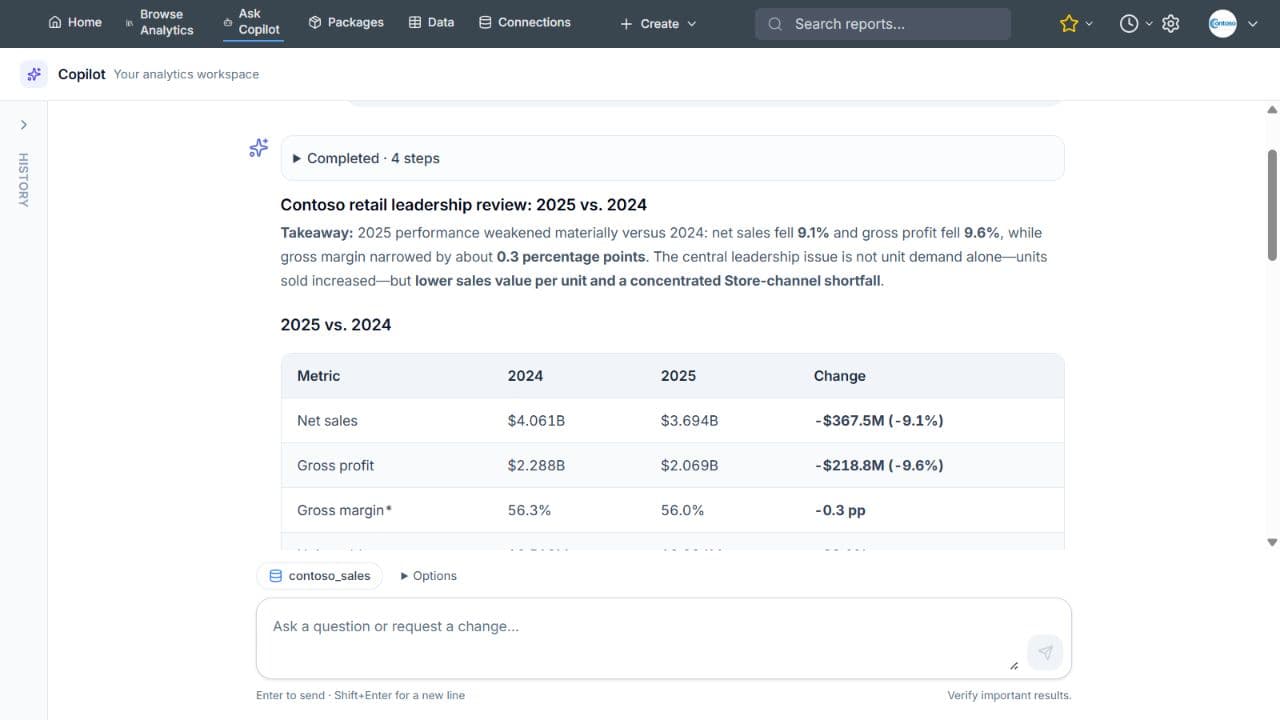
Understand what happened and communicate it clearly.
AI ANALYST + DATA SCIENTIST
InfuseBI investigates what changed, forecasts what comes next, and delivers the charts, models, and evidence your team needs to act.
Why did gross profit improve this quarter?
Higher order volume drove most of the gain. Returns offset part of it.
The example projects steady growth through September. Use the range around the forecast to plan inventory, rather than treating a single number as a promise.
A guided illustration, not live AI. Questions stay in your browser and select a prepared example. Results use synthetic data.
Built for business questions
Start with the decision you need to make. InfuseBI helps you work through the data behind it.
Why did revenue fall? Which products, regions, or customers contributed most to the change?
What might demand look like next quarter? How much uncertainty should our plan allow for?
Which customer groups behave differently? Which costs deserve a closer look?
Two capabilities · one conversation
Move naturally from understanding performance to preparing data, testing an approach, or building a forecast—all in the same analytical workspace.
PERFORMANCE · EXPLANATION · REPORTING
PREPARATION · MODELS · FORECASTS
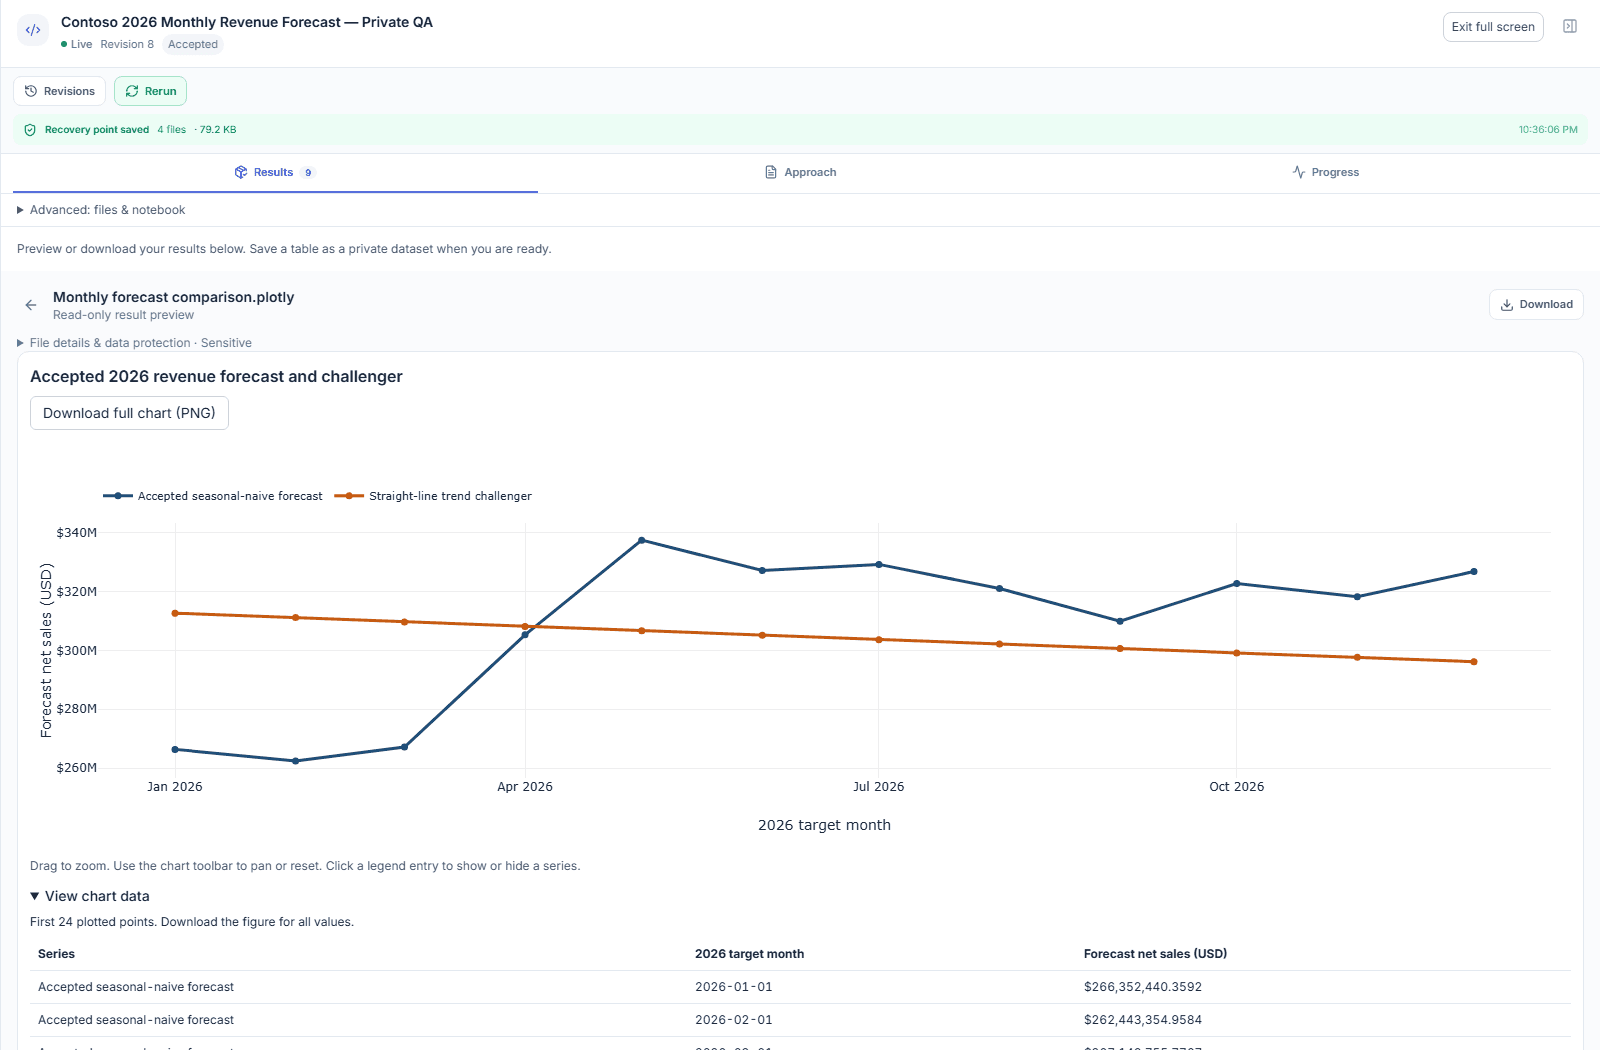
One shared context Ask a follow-up, inspect the work, and turn a useful result into a report, dashboard, or reusable dataset.
You stay in the conversation
Describe the question and choose the data you are allowed to use. Clarify the goal together.
See the findings and supporting evidence. Ask a follow-up, change an assumption, or inspect the deeper analysis.
Share a report, build a dashboard, or save the result for ongoing reporting. Approve a repeatable analysis to run on a schedule.
Explore the connected view
Choose a region or a state. See revenue, product mix, and market performance update together.
Something your team can use
Share clear charts and explanations with your team. Keep the analysis so you can review it and answer follow-up questions.
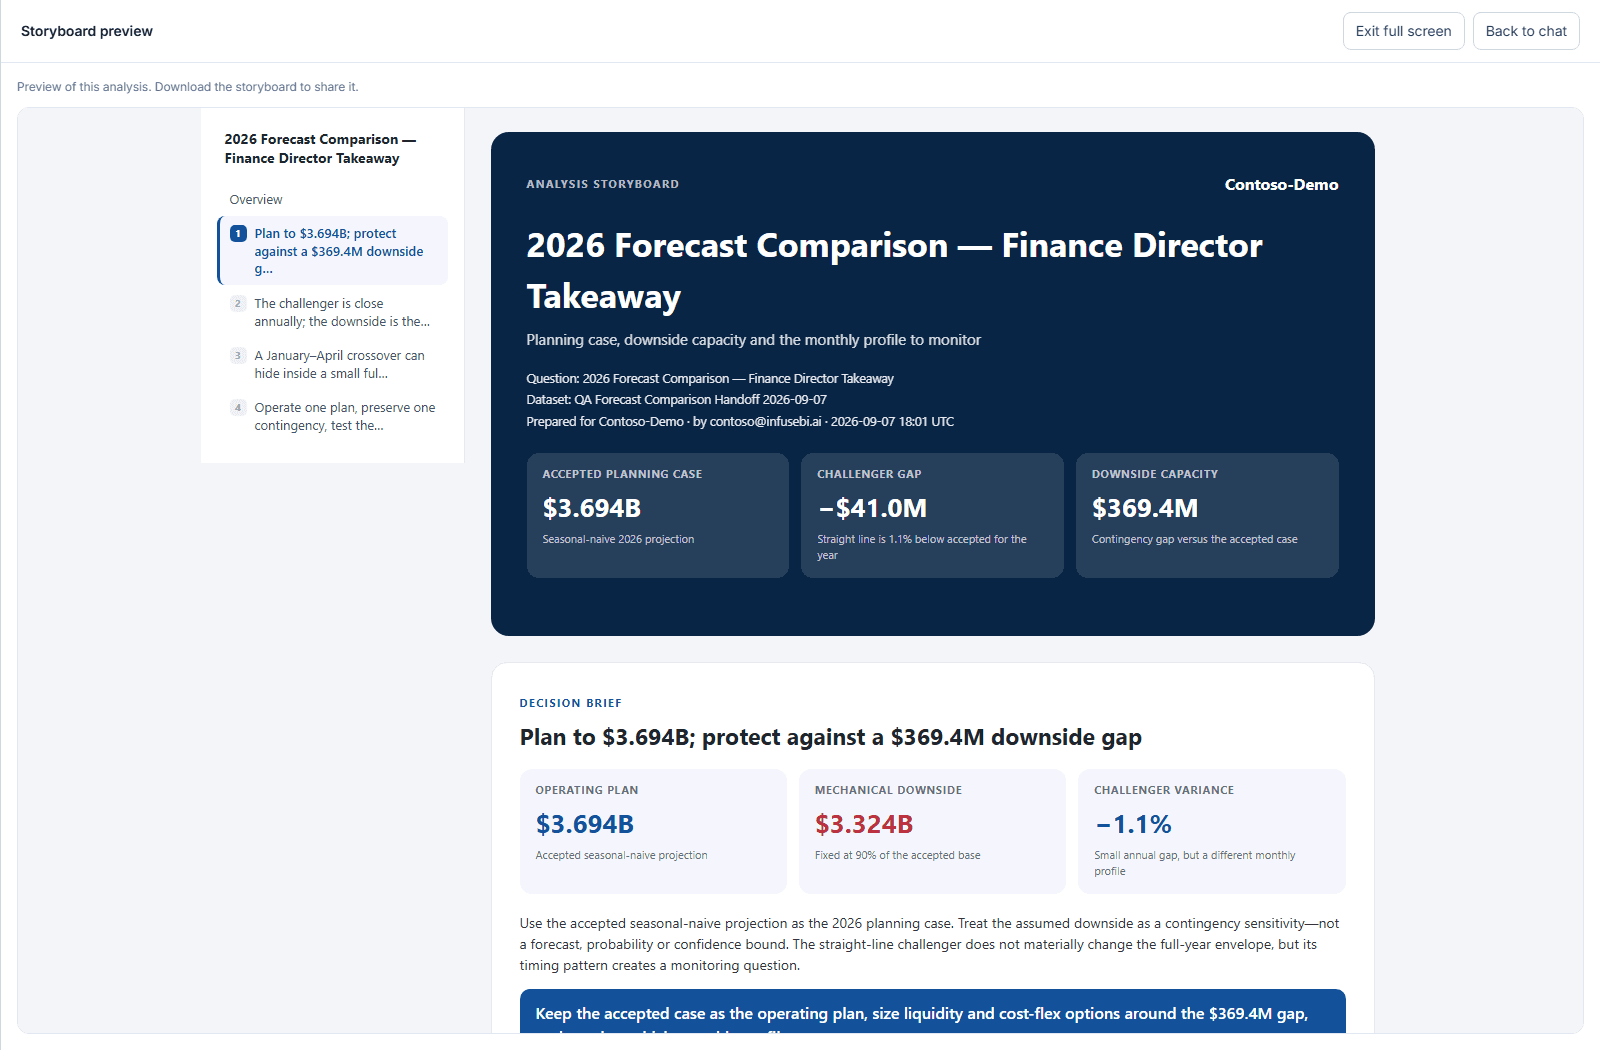
Built for your business
Connect business data or upload a file. Control access, review the evidence, and decide when a result is ready to share.
Work with connected databases and uploaded files. Your team’s business definitions give the analysis context.
Permissions and data controls govern available inputs. Review changes before publishing or scheduling them.
Use the results in InfuseBI reports, dashboards, and customer experiences alongside your existing analytics.
Ready when you are
See how your AI analyst and data scientist can turn it into findings your team can review and use.
FAQ
The data scientist prepares data and executes analytical code for statistical exploration, forecasting, regression, classification, clustering, and anomaly detection. Results include inspectable notebooks and output files. The appropriate method depends on the question, available data, and configured runtime capabilities.
A chart describes a view of the data. A data science task can prepare new data, test an analytical approach, compare models, and produce reusable results. The analyst helps translate the findings into business explanations and visualizations.
Yes. You can review the analysis, its notebook and outputs, and request a follow-up revision. Check assumptions and validation before relying on a model or publishing the result.
Yes. Authorized users can publish results as new datasets or review changes to existing datasets. Approved analysis methods can be configured for recurring refresh, with permission checks and execution history.
No. The website walkthrough uses prepared, synthetic examples and does not call a live AI model. Your question stays in your browser and selects a sample scenario. Request a demo to discuss your own data and workflow.
Yes. The analyst and data scientist sit within InfuseBI’s governed analytics platform, alongside dashboards, reports, pivots, exports, customer workspaces, and embedding.