
Dashboards, reports, and pivots
Reports and dashboards your team can make their own.
Choose charts, adjust filters, and organize the numbers that matter. Use AI to help create a view, export it, or schedule delivery when your permissions allow.
| Region | Q1 | Q2 | Change |
|---|---|---|---|
| West | 482 | 561 | +16.4% |
| Central | 391 | 420 | +7.4% |
| East | 514 | 602 | +17.1% |
| Total | 1,387 | 1,583 | +14.1% |
Group, compare, and drill into a useful view.
How it helps
Create dashboards, detailed reports, and spreadsheet-style pivots in one workspace. Save useful views and share approved results through Excel, PDF, or scheduled reports.
Who this is for
- Customer-facing analytics teams
- Operations and finance users
- SaaS tenants
- Business power users
Explore the connected view
One dashboard. Several ways to understand the business.
Choose a region or a state. See revenue, product mix, and market performance update together.
See the whole business. Then zoom in.
Built-in starting points
Ship analytics faster with built-in reports and dashboards.
Executive dashboards
Reusable KPI and trend layouts for leadership views.
Customer activity reports
Customer-specific reporting with governed fields.
Revenue and margin dashboards
Track financial metrics with formatted measures.
Usage analytics
Show product, account, tenant, or partner activity.
Inside InfuseBI
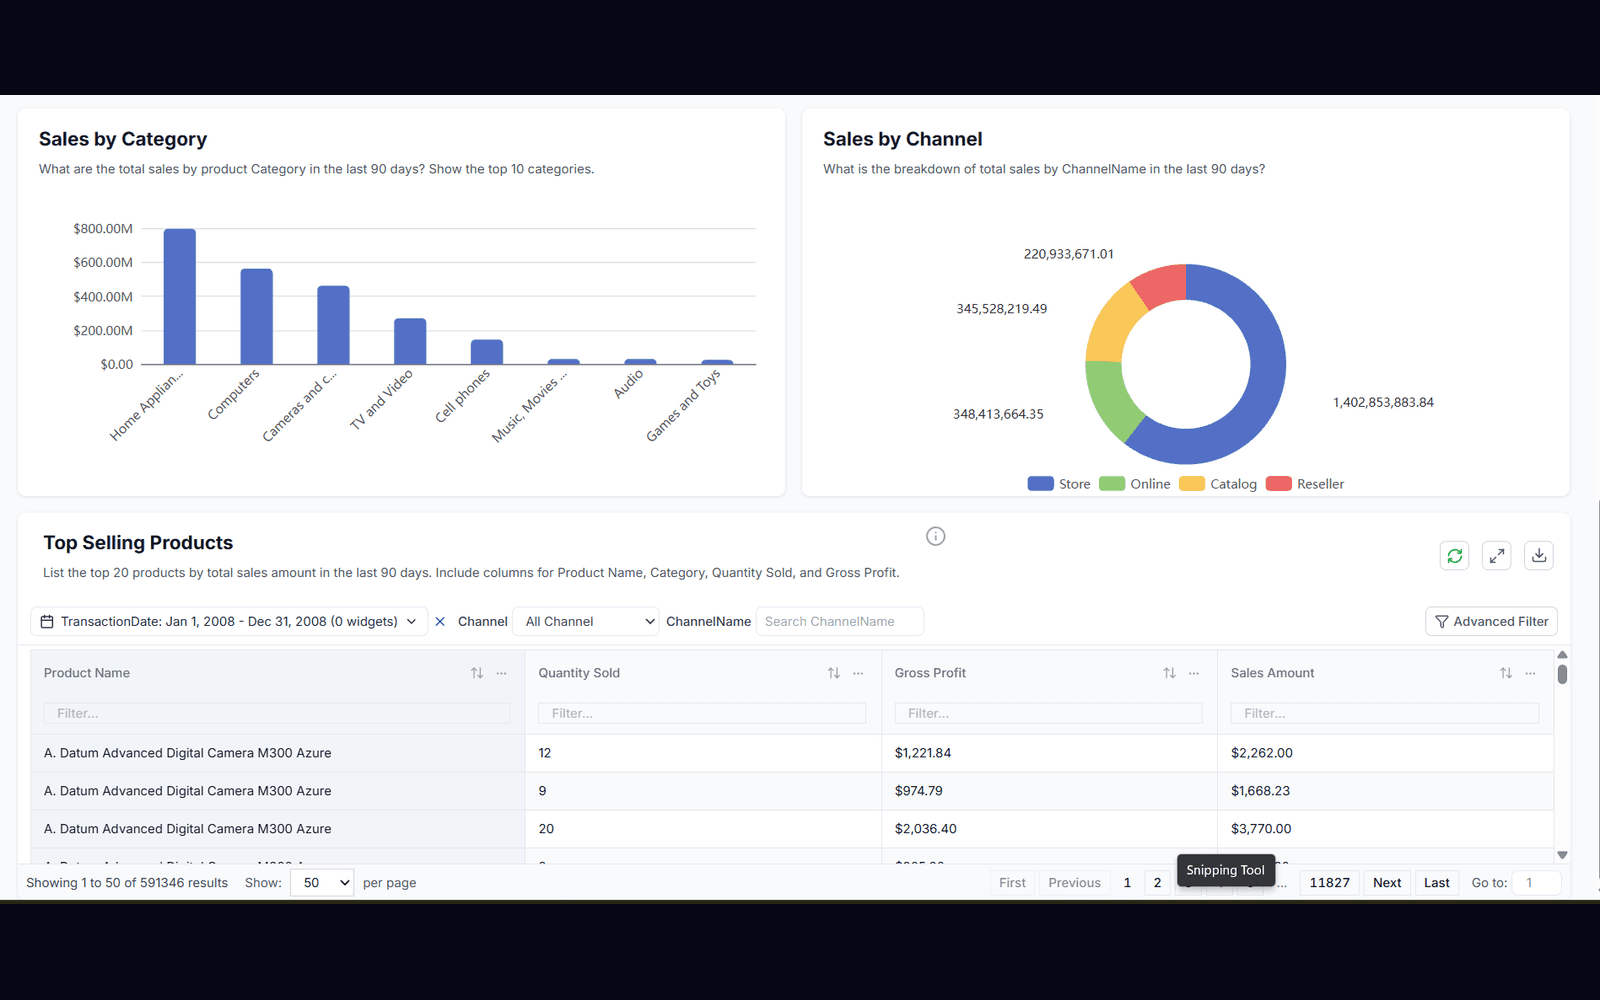
A complete workspace for charts, summaries, and detail.
See the actual dashboard experience: several visualizations and a detailed table, arranged in one view.
Customization
What can users customize?
01
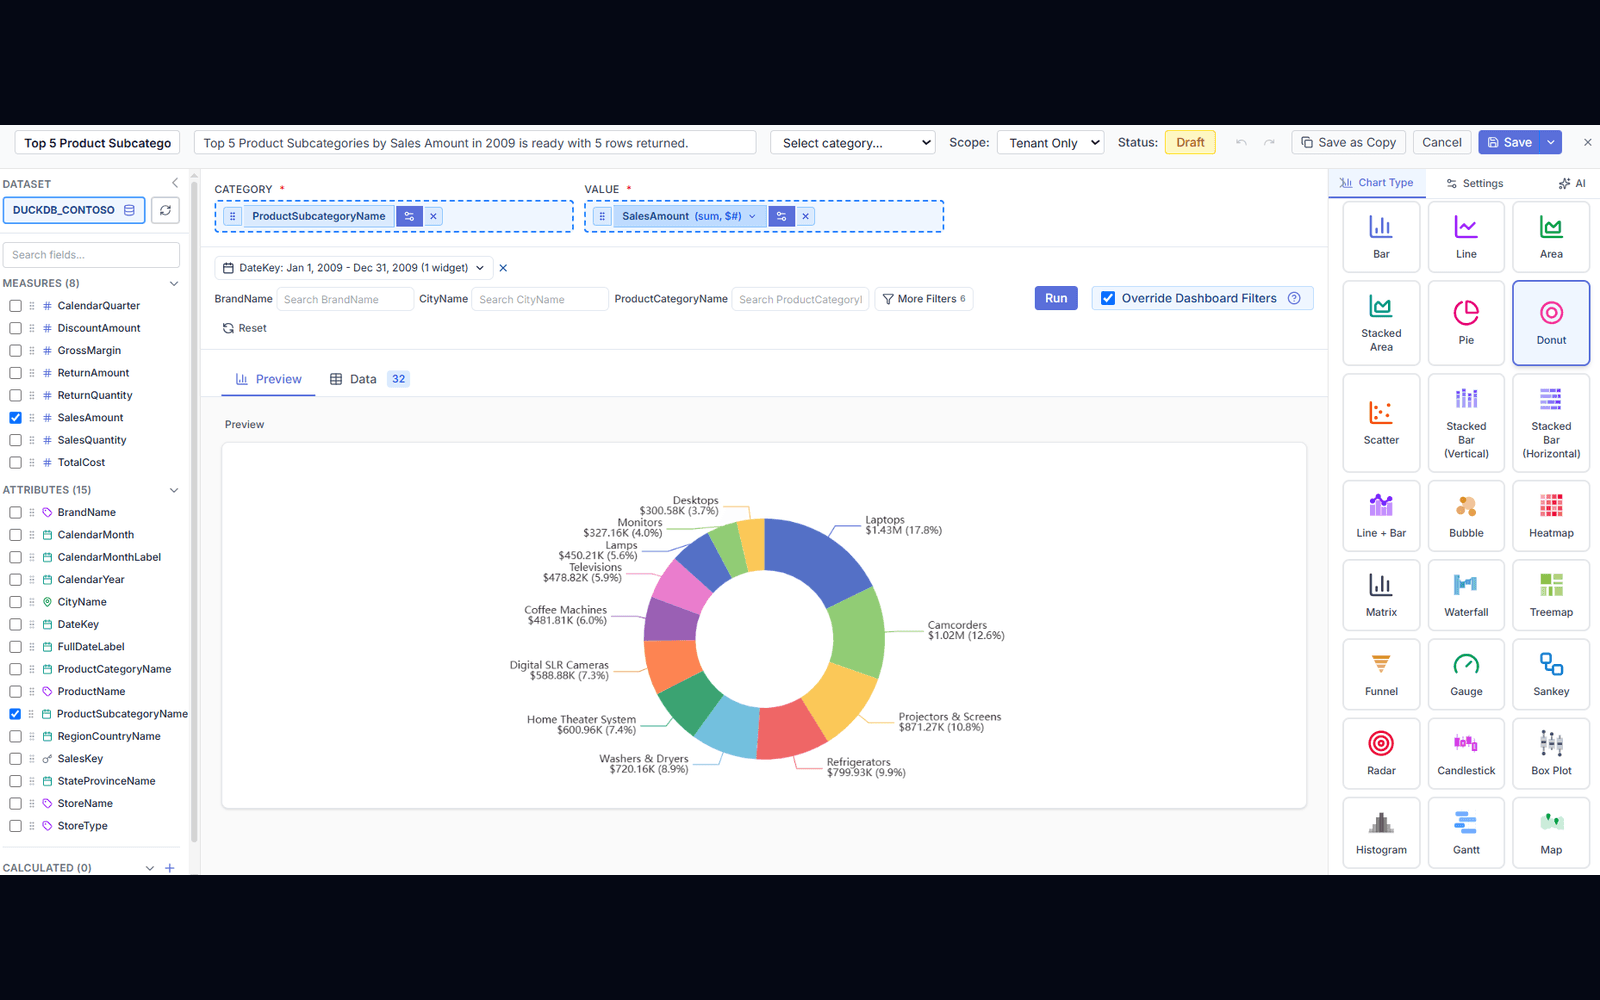
Charts and filters
Add, group, filter, and swap chart types — every widget stays on the governed dataset.
- ✓Add, remove, and rearrange widgets freely
- ✓Swap chart types without losing configuration
- ✓Filters scoped to governed fields
02
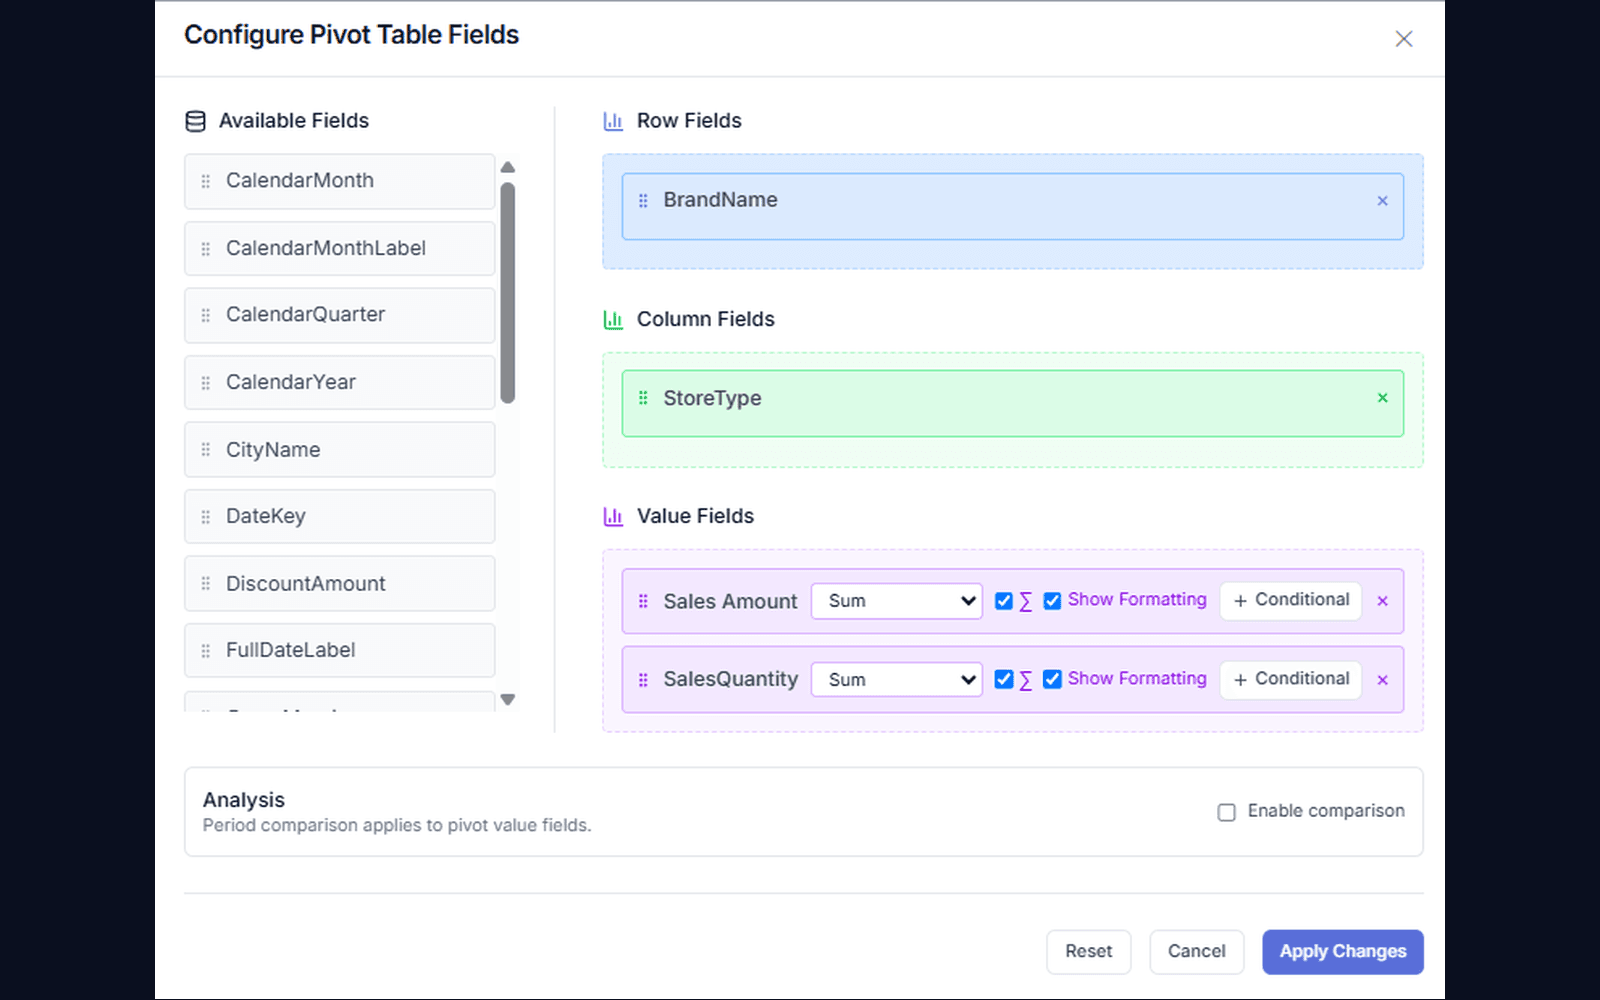
Pivot configuration
Adjust measures, dimensions, subtotals, and saved views with Excel-grade flexibility.
- ✓Drag-and-drop measures and dimensions
- ✓Subtotals, grand totals, and grouping
- ✓Saved views per user and team
03
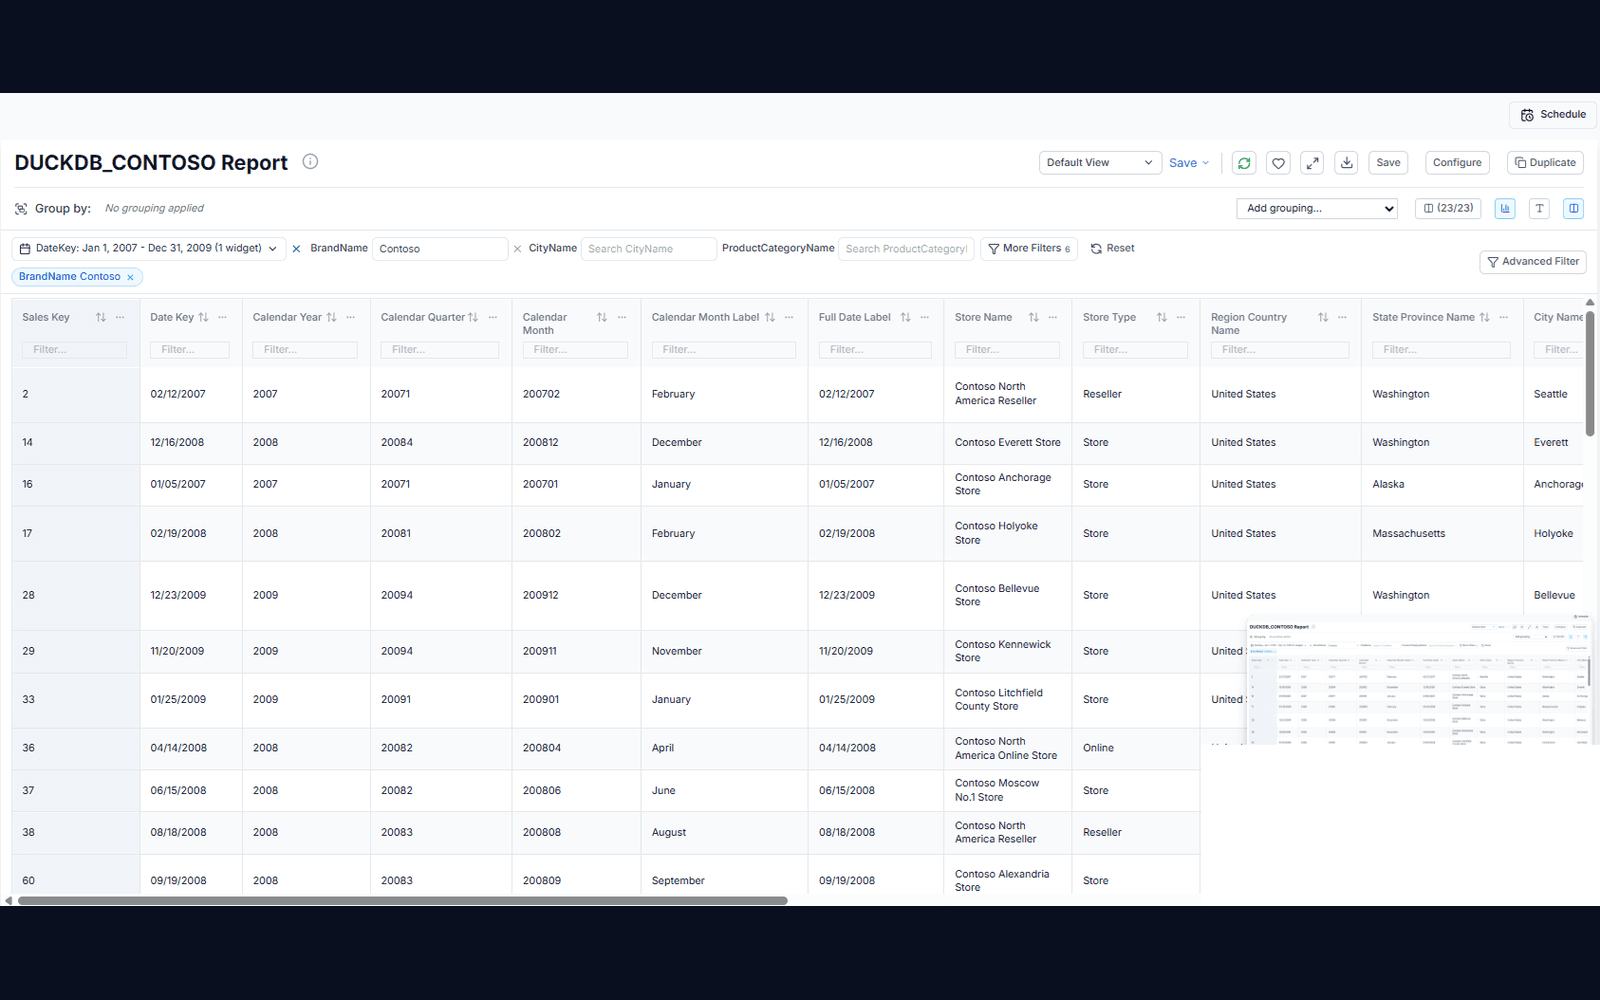
Rich formatting
Currency, dates, statuses, IDs, and links — so every report reads like it was built by hand.
- ✓Currency, percentage, decimal, and date formats
- ✓Status chips, booleans, IDs, and links
- ✓Formats defined once in the semantic model
04
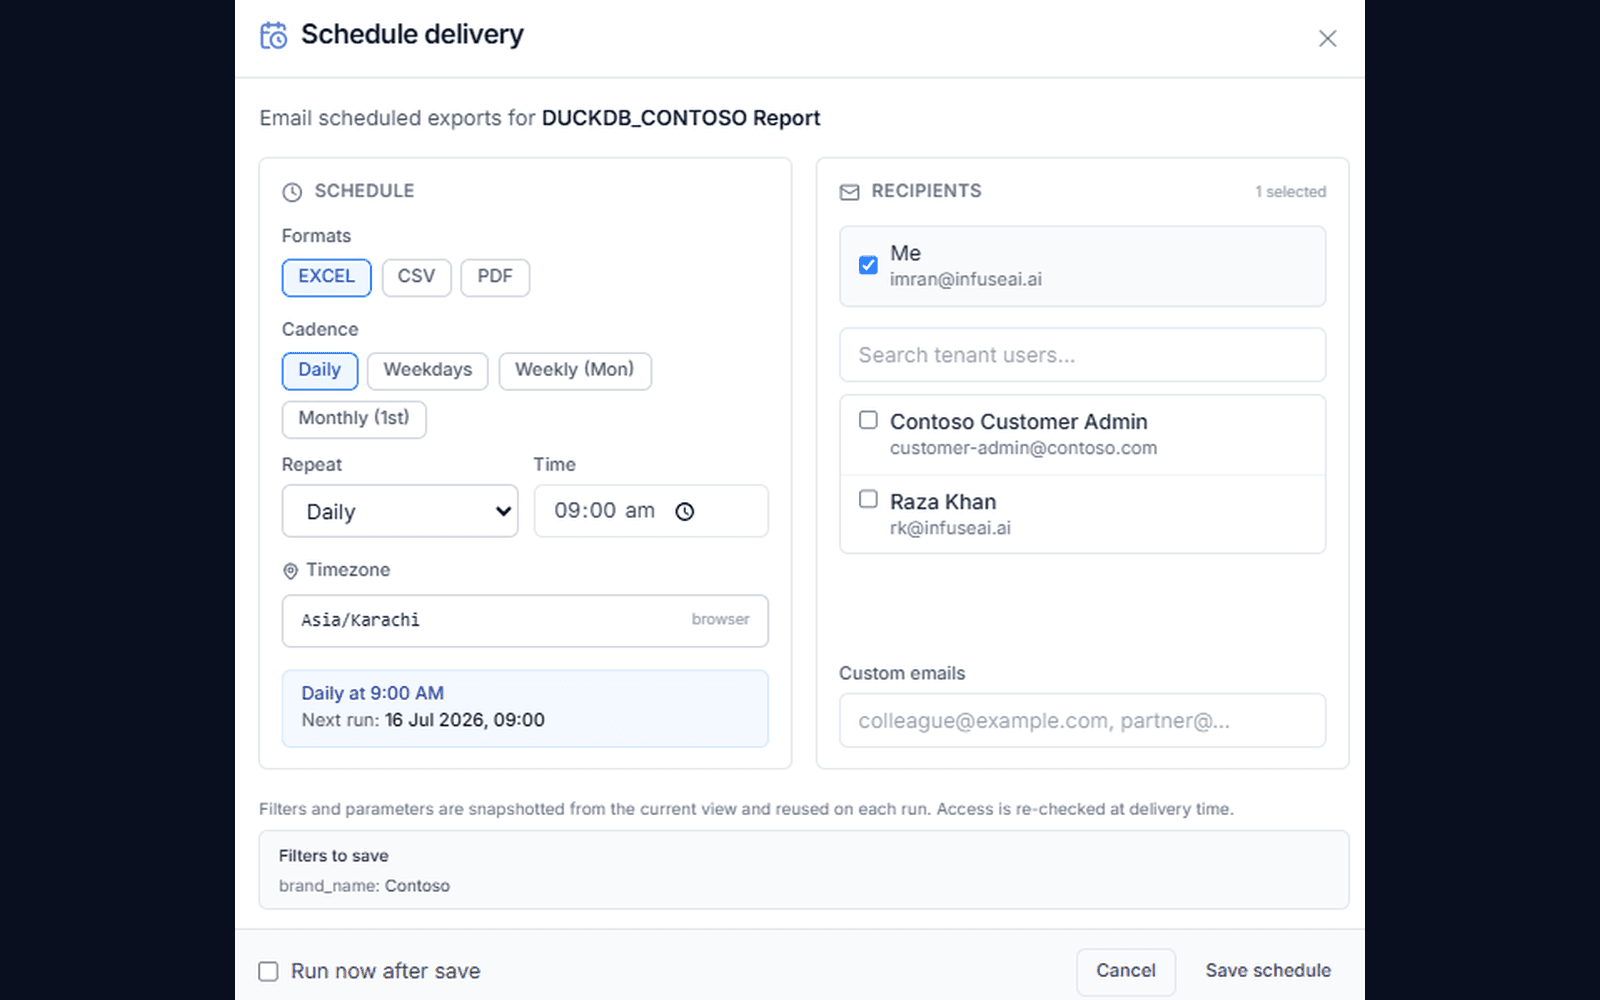
Scheduling and export
Deliver Excel or PDF reports to approved recipients on a recurring schedule.
- ✓One-click Excel and PDF export
- ✓Recurring schedules to approved recipients
- ✓Permissions per role, tenant, and report
How it works
How do built-in and custom analytics fit together?
Start from built-ins
Publish prebuilt dashboards, reports, and pivots your audiences can use immediately.
Allow safe customization
Permissions decide who can adjust charts, filters, pivots, and saved views.
Automate delivery
Users export Excel/PDF or schedule recurring delivery within policy.
Ready when you are
Bring your toughest data question.
See how your AI analyst and data scientist can turn it into findings your team can review and use.
FAQ
Frequently asked questions
Does InfuseBI include reports and pivots?+
Yes. InfuseBI supports dashboards, customizable reports, and Excel-like pivots in the same governed analytics experience. Power users get pivot-grade flexibility without leaving the governed layer.
Can reports be scheduled or exported?+
Yes. Reports and dashboards can be exported or scheduled in Excel and PDF formats depending on permissions. Delivery schedules are governed per role, tenant, and report.
Can we control who exports data?+
Yes. Excel and PDF export and scheduled delivery are permissions in their own right, set by role, tenant, and individual report — so a user can be allowed to explore a dashboard without being allowed to extract it. Every export is logged.